Aviation Weather
full text of the classic FAA guide
THERMAL SOARING
Peter Dixon estimates that about 80 percent of all soaring in the U.S. depends on thermal lift.* What is a thermal? A thermal is simply the updraft in a small-scale convective current. Chapter 4 in the section “Convection,” and chapter 9 in the section, “Convective Currents,” explain the basic principle of convective circulation. The explanations are adequate for the pilot of a powered aircraft; but to the soaring pilot, they are only a beginning.
All pilots scan the weather pattern for convective activity. Remember that turbulence is proportional to the speed at which the aircraft penetrates adjacent updrafts and downdrafts. The fast moving powered aircraft experiences “pounding” and tries to avoid convective turbulence. The slower moving soaring pilot enjoys a gradual change from thermals to areas of sink. He chases after local convective cells using the thermals for lift.
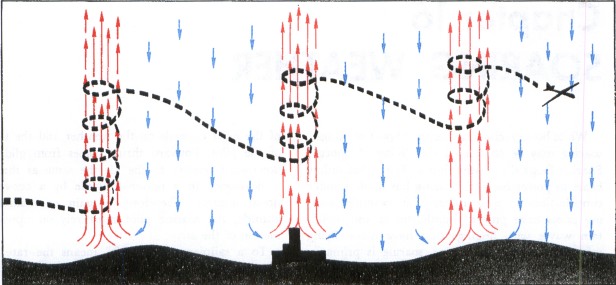
A soaring aircraft is always sinking relative to the air. To maintain or gain altitude, therefore, the soaring pilot must spend sufficient time in thermals to overcome the normal sink of the aircraft as well as to regain altitude lost in downdrafts. He usually circles at a slow airspeed in a thermal and then darts on a beeline to the next thermal as shown in figure 147.
* Peter L. Dixon. SOARING, page 129; 1970; Ballantine Books, New York City.
Low-level heating is prerequisite to thermals; and this heating is mostly from the sun, although it may be augmented by man-made heat sources such as chimneys, factories, and cities. Cool air must sink to force the warm air upward in thermals. Therefore, in small-scale convection, thermals and downdrafts coexist side by side. The net upward displacement of air must equal the net downward displacement. Fast rising thermals generally cover a small percentage of a convective area while slower downdrafts predominate over the remaining greater portion as diagrammed in figure 147.
Since thermals depend on solar heating, thermal soaring is restricted virtually to daylight hours with considerable sunshine. Air tends to become stable at night due to low-level cooling by terrestrial radiation, often resulting in an inversion at or near the surface (see chs. 3 and 6). Stable air suppresses convection, and thermals do not form until the inversion “burns off” or lifts sufficiently to allow soaring beneath the inversion. The earliest that soaring may begin varies from early forenoon to early afternoon, the time depending on the strength of the inversion and the amount of solar heating. Paramount to a pilot's soaring achievement is his skill in diagnosing and locating thermals.
LOCATING THERMALS
Since convective thermals develop from uneven heating at the surface, the most likely place for a thermal is above a surface that heats readily.
Types of Terrain Surfaces
When the sky is cloudless, the soaring pilot must look for those surfaces that heat most rapidly and seek thermals above those areas. Barren sandy or rocky surfaces, plowed fields, stubble fields surrounded by green vegetation, cities, factories, chimneys, etc., are good thermal sources. A pilot learns through experience the most favorable spots in his local area. But terrain features are only part of the story; time of day influences not only when thermals form but also where.
Sun Angle
Angle of the sun profoundly affects location of thermals over hilly landscapes. During early forenoon, the sun strikes eastern slopes more directly than other slopes; therefore, the most favorable areas for thermals are eastern slopes. The favorable areas move to southern slopes during midday. In the afternoon, they move to western slopes before they begin to weaken as the evening sun sinks toward the western horizon. For example, if a rocky knob protrudes above a grassy plain, the most likely area of thermals is over the eastern slope in the forenoon and the western slope in the afternoon. Once a pilot has sighted a likely surface, he may look for other visual cues.
Dust and Smoke
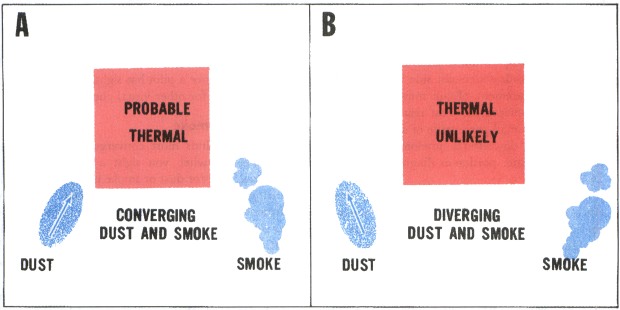
Surface winds must converge to feed a rising thermal; so when you sight a likely spot for a thermal, look for dust or smoke movement near the surface. If you can see dust or smoke “streamers” from two or more sources converging on the spot as shown in figure 148(A), you have chosen wisely. If, however, the streamers diverge as shown in figure 148(B), a downdraft most likely hovers over the spot and it's time to move on.
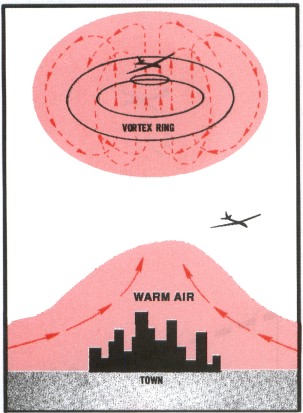
Rising columns of smoke from chimneys and factories mark thermals augmented by man-made sources. These rising columns are positive indication of thermals. They are good sources of lift if upward speed is great enough to support the aircraft and if they are broad enough to permit circling. Towns or cities may provide thermals; but to use a thermal over a populated area, the pilot must have sufficient altitude to glide clear of the area in event the thermal subsides.
Dust Devils
Dust devils occur under sunny skies over sandy or dusty, dry surfaces and are sure signs of strong thermals with lots of lift. To tackle this excellent source of lift, you must use caution. The thermals are strong and turbulent and are surrounded by areas of little lift or possibly of sink.
If approaching the dust devil at too low an altitude, an aircraft may sink to an altitude too low for recovery. A recommended procedure is to always approach the whirling vortex at an altitude 500 feet or more above the ground. At this altitude, you have enough airspace for maneuvering in the event you get into a downdraft or turbulence too great for comfort.
A dust devil may rotate either clockwise or counterclockwise. Before approaching the dusty column, determine its direction of rotation by observing dust and debris near the surface. Philip Wills* quotes R. H. Swinn, Chief Instructor of the Egyptian Gliding School, on approaching and entering a dust devil: “... at around 500 feet; the pilot turns towards the dust devil and cuts his speed as he approaches it to the minimum consistent with the control of the glider. As he nears the whirling column of sand he makes a circle on the outside of the dust devil against the direction of rotation, care being taken to give it a wider berth on the downwind side. In light of the variometer reading on the initial circle, closer contact is made with the column or a hasty retreat is beat to a safer orbit.”
* Philip Wills. ON BEING A BIRD, page 79; 1953; Max Parrish and Co., Ltd.
Why should you enter against the direction of rotation? Figure 149 diagrams a horizontal cross section of a clockwise rotating dust devil and ways of entering it. If you enter with the direction of rotation as on the left, the wind speed is added to your airspeed giving you a fast circling speed probably too great to remain in the thermal. Against the rotation as on the right, wind speed is subtracted from airspeed giving you a slow circling speed.
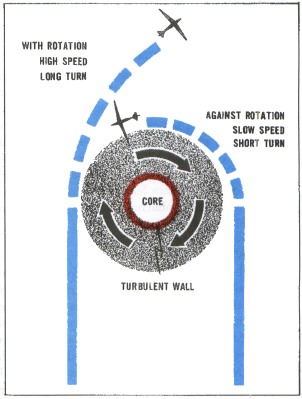
Why slow your airspeed to a minimum? As you approach the increasing headwinds, the inertia of the aircraft causes a surge in airspeed. If your approach is too fast, the surge could push the airspeed above the redline.
Stay out of the “eye” of the vortex. Centrifugal force in the center throws air outward, greatly reducing pressure within the hollow center. The rarified air in the center provides very little lift, and the wall of the hollow center is very turbulent. Further quoting Mr. Swinn,* “A too tight turn on the downwind side put a part of my inside wing into the vortex; the shock threw me into the straps and the wing bent in an alarming manner. This central area of greatly reduced pressure is something to be experienced to be believed. Closely following on this was the shock of hitting the area of greatest uplift just outside the central core. The net result was that the machine was thrown completely out of the column.”
If you are 500 feet or more above the ground but having trouble finding lift, the dust devil is well worth a try. If the thermal is sufficiently broad to permit circling within it, you have it made. The dust column may be quite narrow, but this fact does not necessarily mean the thermal is narrow; the thermal may extend beyond the outer limits of visible dust. The way to find out is to try it. Approach the dusty column against the direction of rotation at minimum airspeed. Enter the column near the outer edge of the dust and stay away from the hollow vortex core. Remain alert; you are circling little more than a wing span away from violent turbulence.
Birds and Sailplanes
Soaring birds have an uncanny ability to locate thermals. When birds remain airborne without flapping their wings, they are riding a thermal. A climbing sailplane also shows the pilot's skill in locating thermals. When fishermen are scattered along a river bank or lake shore, the best place to cast your line is near the fisherman who is catching fish. So it is with soaring. Slip in below the successfully soaring aircraft and catch the thermal he is riding or cut in among or below soaring birds.
Wind causes a thermal to lean with altitude. When seeking the thermal supporting soaring birds or aircraft, you must make allowance for the wind. The thermal at lower levels usually is upwind from your high-level visual cue. A thermal may not be continuous from the surface upward to the soaring birds or sailplane; rather it may be in segments or bubbles. If you are unsuccessful in finding the thermal where you expect it, seek elsewhere.
Cumulus Clouds
When convective clouds develop, thermal soaring usually is at its best and the problem of locating thermals is greatly simplified. In chapter 6 we learned that upward moving air expands and cools as it rises. If the air is moist enough, expansional cooling lowers temperature to the dew point; a convective, or cumulus, cloud forms atop the thermal. Cumulus clouds are positive signs of thermals, but thermals grow and die. A cloud grows with a rising thermal; but when the thermal dies, the cloud slowly evaporates. Because the cloud dissipates after the thermal ceases, the pilot who can spot the difference between a growing and dying cumulus has enhanced his soaring skill.
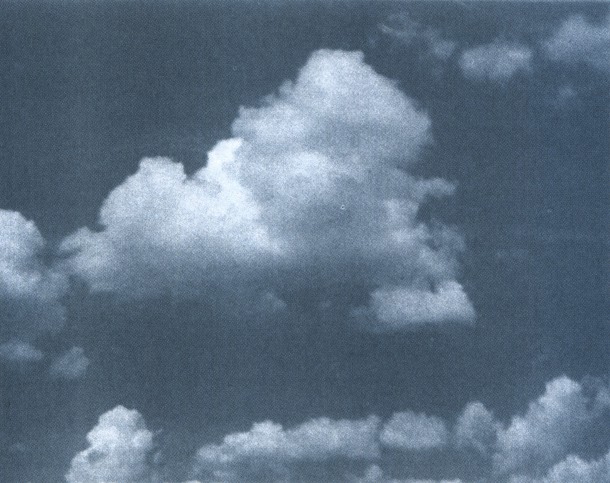
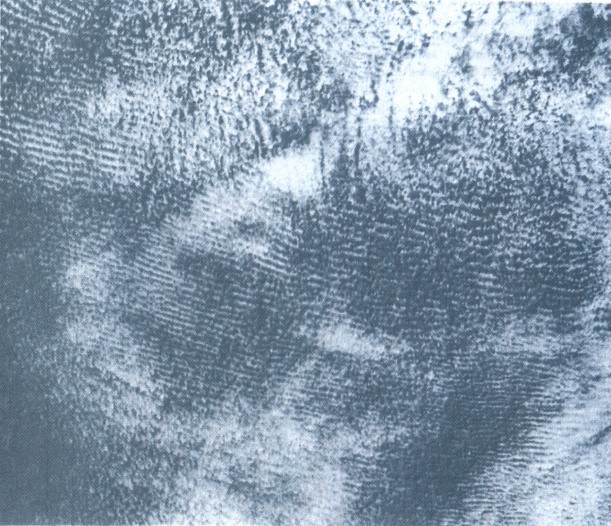
The warmest and most rapidly rising air is in the center of the thermal. Therefore, the cloud base will be highest in the center giving a concave shape to the cloud base as shown in the left and center of figure 150. When the thermal ceases, the base assumes a convex shape as shown on the right. Another cue to look for is the outline of the cloud sides and top. Outline of the growing cumulus is firm and sharp. The dying cumulus has fragmentary sides and lacks the definite outline. These outlines are diagrammed also in figure 150. Figure 151 is a photograph of a dying cumulus.
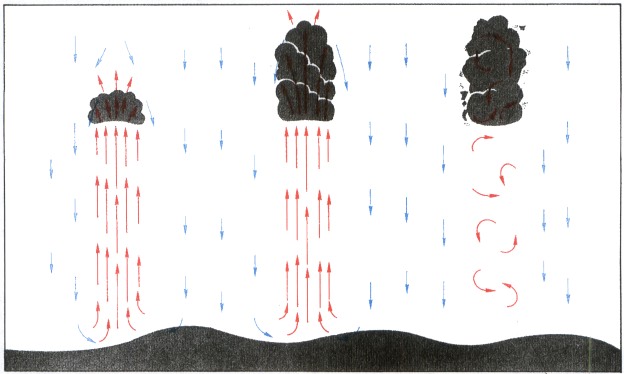
You can expect to find a thermal beneath either of the growing cumuli in figure 150. On the average, the infant cumulus on the left would be the better choice because of its longer life expectancy. This is of course playing the probabilities since all cumuli do not grow to the same size.
As a cumulus cloud grows, it may shade the surface that generated it. The surface cools, temporarily arresting the thermal. As the cloud dissipates or drifts away with the wind, the surface again warms and regenerates the thermal. This intermittent heating is one way in which thermals occur as segments or bubbles.
* Ibid., page 80. Mr. Wills' book discusses at length the splendors and perils of dust devil flying by an experienced soaring pilot. It is recommended reading for a greater insight into this special aspect of soaring.
Cloud cover sometimes increases as surface heating increases until much of the sky is covered. Again, surface heating is cut off causing the thermals to weaken or cease entirely. The cloudiness may then decrease. If it is not too late in the day, thermals will regenerate. In the interim period of extensive cloud cover, you may have no choice but to land and wait for the clouds to move on or decrease in coverage.
The clouds may build upward to a high-level inversion and spread out at the base of the inversion to cover much of the sky. Solar heating is cut off and thermals weaken or die. This type of cloudiness can be persistent, often remaining until near sunset, and can halt thermal soaring until another day.
Although abundant convective cloud cover reduces thermal activity, we cannot quote a definite amount that renders thermals too weak for soaring. About 5/10 cover seems to be a good average approximation. Restriction of thermals by cumulus cloudiness first becomes noticeable at low levels. A sailplane may be unable to climb more than a few hundred feet at a low altitude while pilots at higher levels are maintaining height in or just beneath 6/10 to 8/10 convective cloud cover.
Towering Cumulus and Cumulonimbus
When air is highly unstable, the cumulus cloud can grow into a more ambitious towering cumulus or cumulonimbus. These clouds are a different breed. The energy released by copious condensation can increase buoyancy until the thermals become violent (see chs. 6, 7, and 11). Towering cumulus can produce showers. The cumulonimbus is the thunderstorm cloud producing heavy rain, hail, and icing. Well-developed towering cumulus and cumulonimbus are for the experienced pilot only. Some pilots find strong lift in or near convective precipitation, but they avoid hail which can seriously batter the aircraft and ultimately deplete the wallet.
Violent thermals just beneath and within these highly developed clouds often are so strong that they will continue to carry a sailplane upward even with nose down and airspeed at the redline. The unwary pilot may find himself sucked into the cloud. The soaring pilot who inadvertently entered a thunderstorm and returned to tell about it never hankers for a repeat performance.
Middle and High Cloudiness
Dense, broken or overcast middle and high cloudiness shade the surface cutting off surface heating and convective thermals. On a generally warm bright day but with thin or patchy middle or high cloudiness, cumulus may develop, but the thermals are few and weak. The high-level cloudiness may drift by in patches. Thermals may surge and wane as the cloudiness decreases and increases. Never anticipate optimum thermal soaring when plagued by these mid- and high-level clouds.
Altocumulus castellanus clouds, middle-level convective clouds shown in figure 152, develop in updrafts at and just below the cloud levels. They do not extend upward from the surface. If a sailplane can reach levels near the cloud bases, the updrafts with altocumulus castellanus can be used in the same fashion as thermals formed by surface convection. The problem is reaching the convective level.
Wet Ground
Wet ground favors thermals less than dry ground since wet ground heats more slowly (see ch. 2, “Heat and Temperature”). Some flat areas with wet soil such as swamps and tidewater areas have reputations for being poor thermal soaring areas. Convective clouds may be abundant but thermals generally are weak.
Showery precipitation from scattered cumulus or cumulonimbus is a sure sign of unstable air favorable for thermals. But when showers have soaked the ground in localized areas, downdrafts are almost certain over these wet surfaces. Avoid shower soaked areas when looking for lift.
So much for locating thermals. A pilot can also enhance his soaring skill by knowing what goes on within a thermal.
THERMAL STRUCTURE
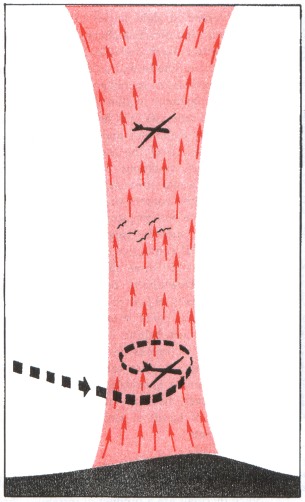
Thermals are as varied as trees in a forest. No two are exactly alike. When surface heating is intense and continuous, a thermal, once begun, continues for a prolonged period in a steady column as in figure 153. Sometimes called the “chimney thermal,” this type seems from experience to be most prevalent. In the chimney thermal, lift is available at any altitude below a climbing sailplane or soaring birds.
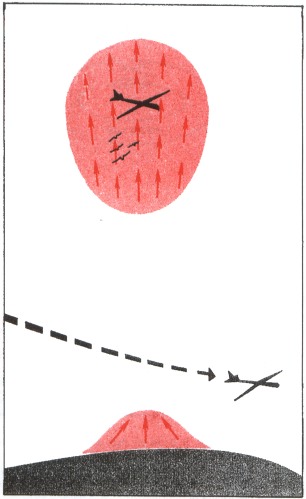
When heating is slow or intermittent, a “bubble” may be pinched off and forced upward; after an interval ranging from a few minutes to an hour or more, another bubble forms and rises as in figure 154. As explained earlier, intermittent shading by cumulus clouds forming atop a thermal is one reason for the bubble thermal. A sailplane or birds may be climbing in a bubble, but an aircraft attempting to enter the thermal at a lower altitude may find no lift.
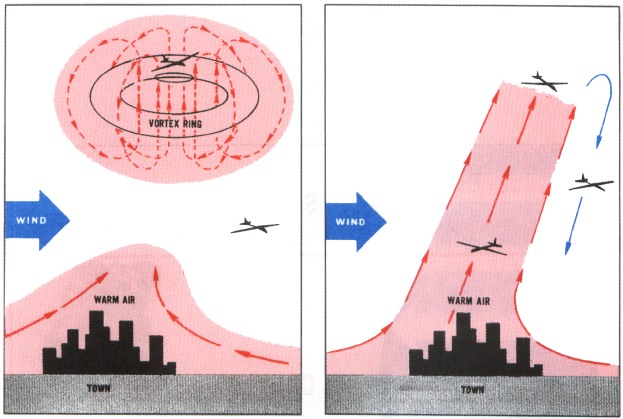
A favored theoretical structure of some bubble thermals is the vortex shell which is much like a smoke ring blown upward as diagrammed in figure 155. Lift is strongest in the center of the ring; downdrafts may occur in the edges of the ring or shell; and outside the shell, one would expect weak downdrafts.
Wind and Wind Shear
Thermals develop with a calm condition or with light, variable wind. However, it seems that a surface wind of 5 to 10 knots favors more organized thermals.
A surface wind in excess of 10 knots usually means stronger winds aloft resulting in vertical wind shear. This shear causes thermals to lean noticeably. When seeking a thermal under a climbing sailplane and you know or suspect that thermals are leaning in shear, look for lift upwind from the higher aircraft as shown in figure 156.
Effect of shear on thermals depends on the relative strength of the two. Strong thermals can remain fairly well organized with strong vertical wind shear; surface wind may even be at the maximum that will allow a safe launch. Weak thermals are disorganized and ripped to shreds by strong vertical wind shear; individual thermal elements become hard to find and often are too small to use for lift. A shear in excess of 3 knots per thousand feet distorts thermals to the extent that they are difficult to use.
No critical surface wind speed can tell us when to expect such a shear. However, shearing action often is visible in cumulus clouds. A cloud sometimes leans but shows a continuous chimney. At other times, the clouds are completely severed into segments by the shear as in figure 157. Remember, however, that this shearing action is at cloud level; thermals below the clouds may be well organized.
We must not overlook one other vital effect of the low-level wind shear. On final approach for landing, the aircraft is descending into decreasing headwind. Inertia of the aircraft into the decreasing wind causes a drop in airspeed. The decrease in airspeed may result in loss of control and perhaps a stall. The result can be an inelegant landing with possible injury and aircraft damage. A good rule is to add one knot airspeed to normal approach speed for each knot of surface wind.
Thermal Streets
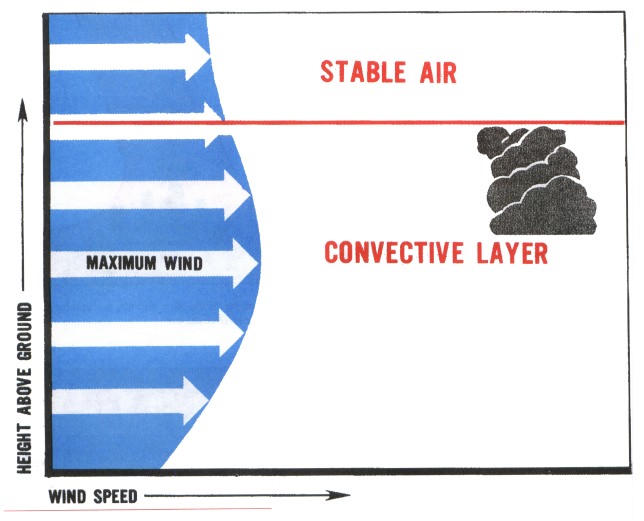
Not infrequently, thermals become organized into “thermal streets.” Generally, these streets are parallel to the wind; but on occasion they have been observed at right angles to the wind. They form when wind direction changes little throughout the convective layer and the layer is capped by very stable air. The formation of a broad system of evenly spaced streets is enhanced when wind speed reaches a maximum within the convective layer; that is, wind increases with height from the surface upward to a maximum and then decreases with height to the top of the convective layer. Figure 158 diagrams conditions favorable for thermal streeting. Thermal streeting may occur either in clear air or with convective clouds.
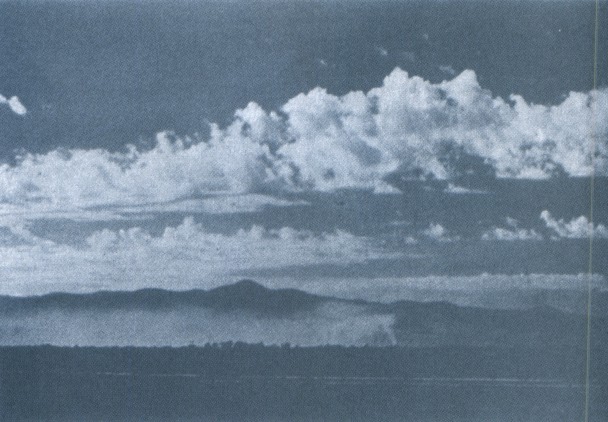
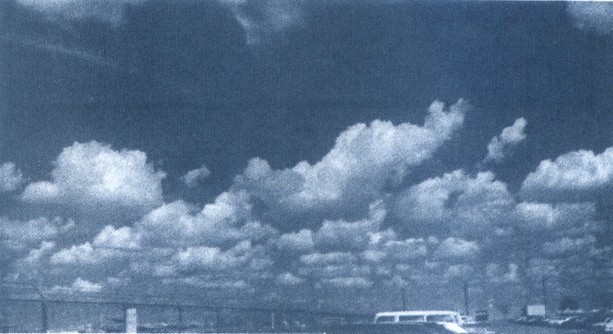
The distance between streets in such a system is two to three times the general depth of the convective layer. If convective clouds are present, this distance is two to three times the height of the cloud tops. Downdrafts between these thermal streets are usually at least moderate and sometimes strong. Cumulus cloud streets frequently form in the United States behind cold fronts in the cold air of polar outbreaks in which relatively flat cumuli develop. A pilot can soar under a cloud street maintaining generally continuous flight and seldom, if ever, have to circle. Figure 159 is a photograph of bands of cumulus clouds marking thermal streets.
HEIGHT AND STRENGTH OF THERMALS
Since thermals are a product of instability, height of thermals depends on the depth of the unstable layer, and their strength depends on the degree of instability. If the idea of instability is not clear to you, now is the time to review chapter 6.
Most likely you will be soaring from an airport with considerable soaring activity—possibly the home base of a soaring club—and you are interested in a soaring forecast. Your airport may have an established source of a daily soaring weather forecast from the National Weather Service. If conditions are at all favorable for soaring, you will be specifically interested in the earliest time soaring can begin, how high the thermals will be, strength of the thermals, cloud amounts—both convective and higher cloudiness—visibility at the surface and at soaring altitudes, probability of showers, and winds both at the surface and aloft. The forecast may include such items as the thermal index (TI), the maximum temperature forecast, and the depth of the convective layer.
Many of these parameters the forecaster determines from upper air soundings plotted on a pseudo-adiabatic chart. If you become familiar with this chart, you can better grasp the meanings of some of these forecast parameters; and you may try a little forecasting on your own.
The Pseudo-Adiabatic Chart
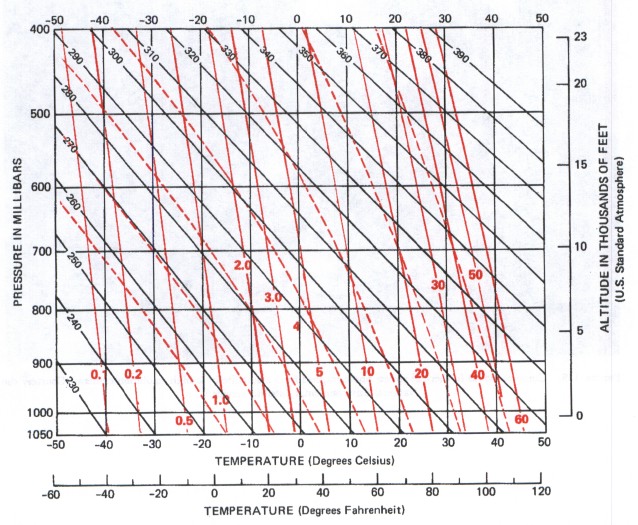
The pseudo-adiabatic chart is used to graphically compute adiabatic changes in vertically moving air and to determine stability. It has five sets of lines shown in figure 160. These lines are:
Pressure in millibars (horizontal lines),
Temperature in degrees Celsius (vertical lines),
Dry adiabats (sloping black lines),
Lines of constant water vapor or mixing ratio* (solid red lines), and
Moist adiabats (dashed red lines).
The chart also has an altitude scale in thousands of feet along the right margin and a Fahrenheit temperature scale across the bottom.
You might like to get one of these charts from a National Weather Service Office. The chart used in actual practice has a much finer grid than the one shown in figure 160. You can cover the chart with acetate and check examples given here along with others you can develop yourself. This procedure can greatly enhance your feel for processes occurring in a vertically moving atmosphere.
* Ratio of water vapor to dry air.
Examples shown here deal with dry thermals; and since the red lines in figure 160 concern moist adiabatic changes, they are omitted from the examples. If you care to delve deeper into use of the chart, you will find moist adiabatic processes even more intriguing than dry processes.
Plotted Sounding
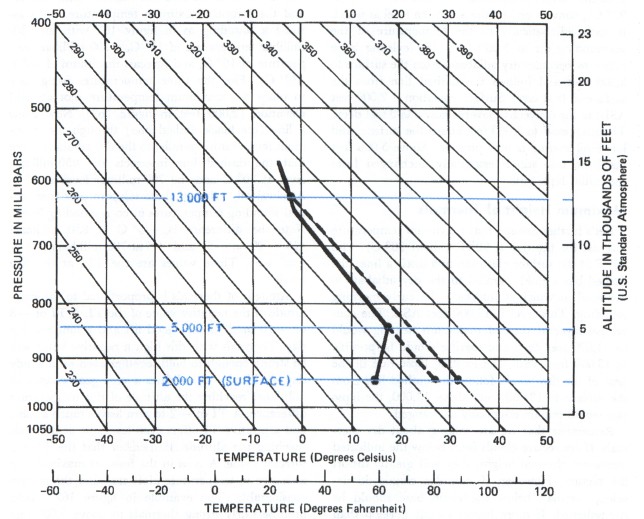
An upper air observation, or sounding, is plotted on the pseudo-adiabatic chart as shown by the heavy, solid black line in figure 161. This plotting is the vertical temperature profile at the time the radiosonde observation was taken. It is the actual or existing lapse rate (see ch. 6). Blue lines are added to the illustration showing appropriate altitudes to aid you in interpreting the chart.
Depth of Convective Layer (Height of Thermals)
We know that for air to be unstable, the existing lapse rate must be equal to or greater than the dry adiabatic rate of cooling. In other words, in figure 161, the solid black line representing the plotted existing lapse rate would slope parallel to or slope more than the dry adiabats. Obviously it does not. Therefore, at the time the sounding was taken, the air was stable; there was no convective or unstable layer, and thermals were nonexistent. Thermal soaring was impossible.
Now assume that the sounding was made about the time of sunrise. Surface temperature was 59° F (15°C). As temperature rises near the surface during the day, air in the lower levels is warmed and forced upward, cooling at the dry adiabatic rate. Convection begins in the lowest levels. By the time the surface temperature reaches 80° F (about 27° C), convection lifts the air to the level at which it cools adiabatically to the temperature of the surrounding air at 5,000 feet. The existing lapse rate now becomes dry adiabatic from the surface to 5,000 feet and follows the dashed line from the surface to that level. Surface elevation is 2,000 feet ASL; so the convective layer is now 3,000 feet deep. Thermals exist to 3,000 feet above the surface, and low-level soaring is now possible. Above 5,000 feet the lapse rate still is essentially unchanged from the initial lapse rate.
Maximum Height of Thermals
Let's further assume that maximum temperature forecast for the day is 90° F (about 30° C). Plot 90° F at the surface elevation and draw a line (the dashed black line) parallel to the dry adiabats to the level at which it intersects the early morning sounding. This level is 13,000 feet ASL. The convective layer at time of maximum heating would be 11,000 feet deep and soaring should be possible to 13,000 feet ASL. The existing lapse rate in the heat of the day would follow the dashed line from the surface to 13,000 feet; above 13,000, the lapse rate would remain essentially unchanged.
Remember that we are talking about dry thermals. If convective clouds form below the indicated maximum thermal height, they will greatly distort the picture. However, if cumulus clouds do develop, thermals below the cloud base should be strengthened. If more higher clouds develop than were forecast, they will curtail surface heating, and most likely the maximum temperature will be cooler than forecast. Thermals will be weaker and will not reach as high an altitude.
Thermal Index (TI)
Since thermals depend on sinking cold air forcing warm air upward, strength of thermals depends on the temperature difference between the sinking air and the rising air—the greater the temperature difference the stronger the thermals. To arrive at an approximation of this difference, the forecaster computes a thermal index (TI).
A thermal index may be computed for any level; but ordinarily, indices are computed for the 850-and 700-millibar levels, or about 5,000 and 10,000 feet respectively. These levels are selected because they are in the altitude domain of routine soaring and because temperature data are routinely available for these two levels.
Three temperature values are needed—the observed 850-millibar and 700-millibar temperatures and the forecast maximum temperature. Let's assume a sounding as in figure 162 with an 850-millibar temperature of 15° C, a 700-millibar temperature of 10° C, and forecast maximum of 86° F (30° C). Plot the three temperatures using care to place the maximum temperature plot at field elevation (2,000 feet in figure 162). Now draw a line (the black dashed line) through the maximum temperature parallel to the dry adiabats. Note that the dashed line intersects the 850-millibar level at 20° C and the 700-millibar level at 4° C. Algebraically subtract these temperatures from actual sounding temperatures at corresponding levels. Note the difference is −5° C at 850 millibars (15 − 20 = −5) and +6 at 700 millibars (10 − 4= +6). These values are the TI's at the two levels.
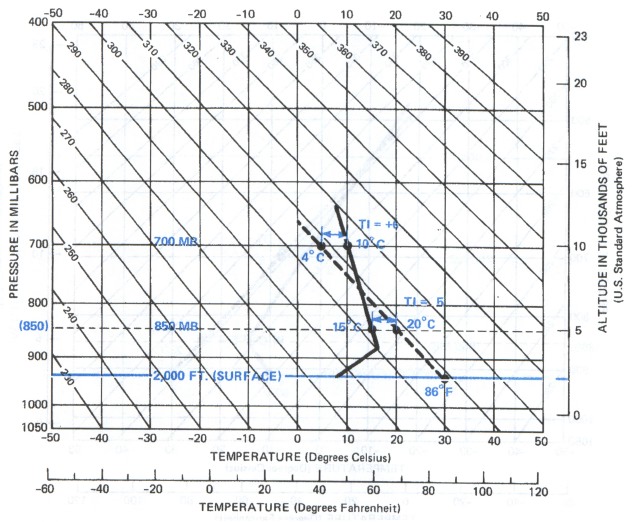
Strength of thermals is proportional to the magnitude of the negative value of the TI. A TI of − 8 or −10 predicts very good lift and a long soaring day. Thermals with this high a negative value will be strong enough to hold together even on a windy day. A TI of −3 indicates a very good chance of sailplanes reaching the altitude of this temperature difference. A TI of −2 to zero leaves much doubt; and a positive TI offers even less hope of thermals reaching the altitude. Remember that the TI is a forecast value. A miss in the forecast maximum or a change in temperature aloft can alter the picture considerably. The example in figure 162 should promise fairly strong thermals to above 5,000 feet but no thermals to 10,000.
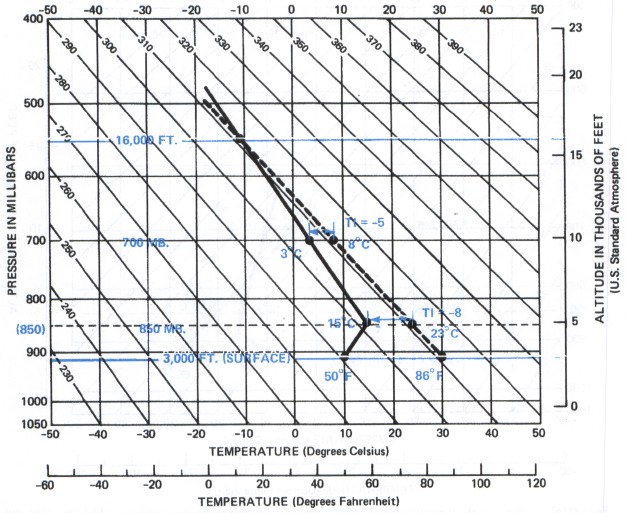
Figure 163 is another example showing an early morning sounding with a 3,000-foot surface temperature of 10° C (50° F), an 850-millibar temperature of 15° C, a 700-millibar temperature of 3° C, and a forecast maximum of 86° F (30° C). What are the TI's at 850 and 700 millibars? Would you expect thermals to 850 millibars? Would they be moderate, strong, or weak? How about at 700 millibars? What is the maximum altitude you would expect thermals to reach? Answers: 850-millibar TI, −8; 700-millibar TI, −5; thermals would reach both levels, strong at 850, moderate at 700; maximum altitude of thermals, about 16,000 feet ASL.
Often the National Weather Service will have no upper air sounding taken near a soaring base. Forecasts must be based on a simulated sounding derived from distant observations. At other times, for some reason a forecast may not be available. Furthermore, you can often augment the forecast with local observations. You are never at a complete loss to apply some of the techniques just described.
Do It Yourself
The first step in determining height and strength of thermals is to obtain a local sounding. How do you get a local sounding? Send your tow aircraft aloft about sunrise and simply read outside air temperatures from the aircraft thermometer and altitudes from the altimeter. Read temperatures at 500-foot intervals for about the first 2,000 feet and at 1,000-foot intervals at higher altitudes. The information may be radioed back to the ground, or may be recorded in flight and analyzed after landing. When using the latter method, read temperatures on both ascent and descent and average the temperatures at each level. This type of sounding is an airplane observation or APOB. Plot the sounding on the pseudo-adiabatic chart using the altitude scale rather than the pressure scale.
Next we need a forecast maximum temperature. Perhaps you can pick up this forecast temperature from the local forecast. If not, you can use your best judgment comparing today's weather with yesterday's.
Following is an APOB as taken by the tow aircraft from an airport elevation of 1,000 feet ASL:
| Temperatures °C | |||
| Alt. | Ascent | Descent | Avg. |
| 1000 | 17 | 19 | 18 |
| 1500 | 15 | 17 | 16 |
| 2000 | 20 | 20 | 20 |
| 2500 | 22 | 24 | 23 |
| 3000 | 22 | 22 | 22 |
| 4000 | 20 | 18 | 19 |
| 5000 | 18 | 18 | 18 |
| 6000 | 16 | 14 | 15 |
| 7000 | 13 | 13 | 13 |
| 8000 | 9 | 9 | 9 |
| 9000 | 7 | 5 | 6 |
| 10000 | 5 | 3 | 4 |
| 11000 | 1 | 1 | 1 |
| 12000 | −3 | −1 | −2 |
| 13000 | −5 | −5 | −5 |
| 14000 | −6 | −6 | −6 |
| 15000 | −7 | .. | −7 |
Plot the APOB on the pseudo-adiabatic chart using the average temperatures from the last column. Figure 164 shows the plotted APOB.
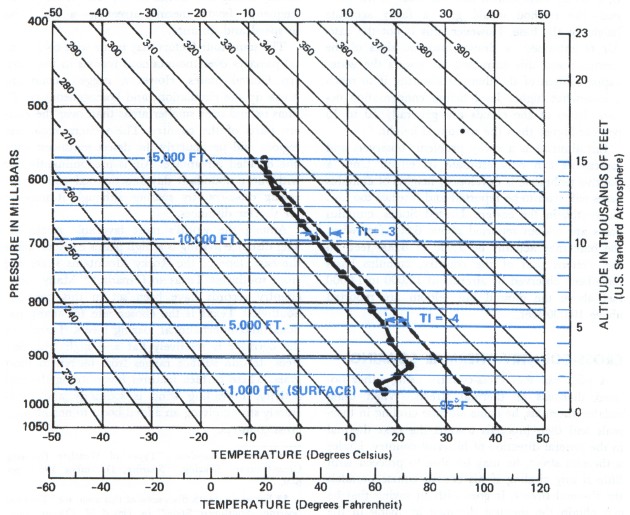
Next we need a forecast maximum temperature. Let's assume that a local forecast is not available and that weather today is essentially the same as it was yesterday. Yesterday's maximum was 95° F (35° C), so let's use the same maximum for today. We should not be too far wrong. Plot the maximum as shown and proceed to compute TI's and maximum height of thermals. Since our temperature data are for indicated altitudes rather than pressure levels, let's compute TI's for 5,000 feet and 10,000 feet rather than for pressure levels. What do you get for a TI at 5,000 feet? At 10,000 feet? What is the anticipated maximum altitude of thermals? Answers: TI at 5,000 feet, −4; TI at 10,000 feet, −3; maximum altitude of thermals, 14,000 feet.
Although these procedures are primarily for dry thermals, they work reasonably well for thermals below the bases of convective clouds.
Convective Cloud Bases
Soaring experience suggests a shallow, stable layer immediately below the general level of convective cloud bases through which it is difficult to soar. This layer is 200 to 600 feet thick and is known as the sub-cloud layer. The layer appears to act as a filter allowing only the strongest thermals to penetrate it and form convective clouds. Strongest thermals are beneath developing cumulus clouds.
Thermals intensify within a convective cloud; but evaporation cools the outer edges of the cloud causing a downdraft immediately surrounding it. Add to this the fact that downdrafts predominate between cumulus clouds, and you can see the slim chance of finding lift between clouds above the level of the cloud base. In general, thermal soaring during convective cloud activity is practical only at levels below the cloud base.
In chapter 6, we learned to estimate height in thousands of feet of a convective cloud base by dividing the surface temperature—dew point spread by 4. If the rising column were self-contained—that is, if no air were drawn into the sides of the thermal—the method would give a fairly accurate height of the base. However, this is not the case. Air is entrained or drawn into the sides of the thermal; and this entrained air lowers the water vapor content of the thermal allowing it to reach a somewhat higher level before condensation occurs. Bases of the clouds are generally 10 to 15 percent higher than the computed height.
Entrainment is a sticky problem; observers and forecasters can only estimate its effect. Until a positive technique is developed, heights of cumulus bases will tend to be reported and forecast too low. Currently, in the eastern United States, cumulus bases are seldom reported above 6,000 feet when the base may actually be 7,000 or 8,000 feet. In the western part of the country, cumulus bases have been observed by aircraft at 12,000 to 14,000 feet above the ground but seldom are reported above 10,000 feet.
CROSS-COUNTRY THERMAL SOARING
A pilot can soar cross-country using either isolated thermals or thermal streets. When using isolated thermals, he gains altitude circling in thermals and then proceeds toward the next thermal in the general direction of his cross-country. Under a thermal street, he may be able to proceed with little if any circling if his chosen course parallels the thermal streets. It goes without saying that he can obtain the greatest distance by flying in the direction of the wind.
In the central and eastern United States, the most favorable weather for cross-country soaring occurs behind a cold front. Lindsay* has found that about 82 percent of thermal cross-countrys in these areas were made after a cold front had passed and ahead of the following high pressure center. Four factors contribute to making this pattern ideal. (1) The cold polar air is usually dry, and thermals can build to relatively high altitudes. (2) The polar air is colder than the ground; and thus, the warm ground aids solar radiation in heating the air. Thermals begin earlier in the morning and last later in the evening. On occasions, soarable lift has been found at night. (3) Quite often, colder air at high altitudes moves over the cold, low-level outbreak intensifying the instability and strengthening the thermals. (4) The wind profile frequently favors thermal streeting—a real boon to speed and distance.
The same four factors may occur with cold frontal passages over mountainous regions in the western United States. However, rugged mountains break up the circulation; and homogeneous conditions extend over smaller areas than over the eastern parts of the country. The western mountain regions and particularly the desert southwest have one decided advantage. Air is predominantly dry with more abundant daytime thermal activity favoring cross-country soaring although it may be for shorter distances.
Among the world's most favorable tracks for long distance soaring is a high plains corridor along the east slope of the Rocky Mountains stretching from southwest Texas to Canada.** Many crosscountry records have been set in this corridor. Southwest Texas is the chosen site for many national and international soaring meets. Terrain in the corridor is relatively flat and high with few trees; terrain surface ranges from barren to short grass. These surface features favor strong thermal activity. Prevailing wind is southerly and moderately strong giving an added boost to northbound cross-countrys.
* Charles V. Lindsay. “Types of Weather Favoring Cross-Country Soaring.” Soaring, December 1964, pp. 6–9.
** For an in-depth discussion of this area, see “Thermal Soaring—Southwest Style,” by David H. Owens, Soaring, May 1966, pp. 10–12.
Table of Contents
Previous Section: Soaring Weather
Next Section: Frontal Soaring
A PDF version of this book is available here. You may be able to buy a printed copy of the book from amazon.com.