Aviation Weather
full text of the classic FAA guide
ATMOSPHERIC PRESSURE
Atmospheric pressure is the force exerted by the weight of the atmosphere. Since air is not solid, we cannot weigh it with conventional scales. Yet, Toricelli proved three centuries ago that he could weigh the atmosphere by balancing it against a column of mercury. He actually measured pressure converting it directly to weight.
MEASURING PRESSURE
The instrument Toricelli designed for measuring pressure is the barometer. Weather services and the aviation community use two types of barometers in measuring pressure—the mercurial and aneroid.
The Mercurial Barometer
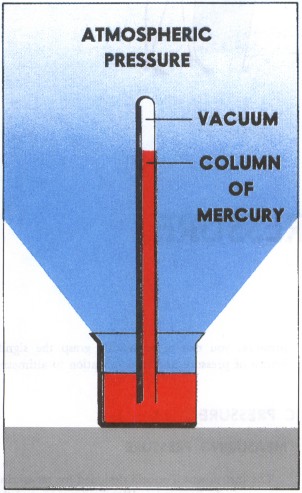
The mercurial barometer, diagrammed in figure 8, consists of an open dish of mercury into which we place the open end of an evacuated glass tube. Atmospheric pressure forces mercury to rise in the tube. At stations near sea level, the column of mercury rises on the average to a height of 29.92 inches or 760 millimeters. In other words, a column of mercury of that height weighs the same as a column of air having the same cross section as the column of mercury and extending from sea level to the top of the atmosphere.
Why do we use mercury in the barometer? Mercury is the heaviest substance available which remains liquid at ordinary temperatures. It permits the instrument to be of manageable size. We could use water, but at sea level the water column would be about 34 feet high.
The Aneroid Barometer
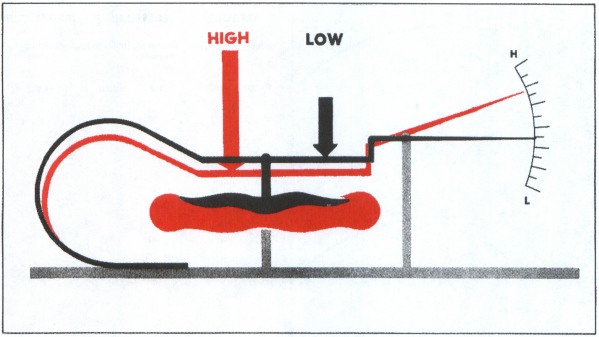
Essential features of an aneroid barometer illustrated in figure 9 are a flexible metal cell and the registering mechanism. The cell is partially evacuated and contracts or expands as pressure changes. One end of the cell is fixed, while the other end moves the registering mechanism. The coupling mechanism magnifies movement of the cell driving an indicator hand along a scale graduated in pressure units.
Pressure Units
Pressure is expressed in many ways throughout the world. The term used depends somewhat on its application and the system of measurement. Two popular units are “inches of mercury” or “millimeters of mercury.” Since pressure is force per unit area, a more explicit expression of pressure is “pounds per square inch” or “grams per square centimeter.” The term “millibar” precisely expresses pressure as a force per unit area, one millibar being a force of 1,000 dynes per square centimeter. The millibar is rapidly becoming a universal pressure unit.
Station Pressure
Obviously, we can measure pressure only at the point of measurement. The pressure measured at a station or airport is “station pressure” or the actual pressure at field elevation. We know that pressure at high altitude is less than at sea level or low altitude. For instance, station pressure at Denver is less than at New Orleans. Let's look more closely at some factors influencing pressure.
PRESSURE VARIATION
Pressure varies with altitude and temperature of the air as well as with other minor influences which we neglect here.
Altitude
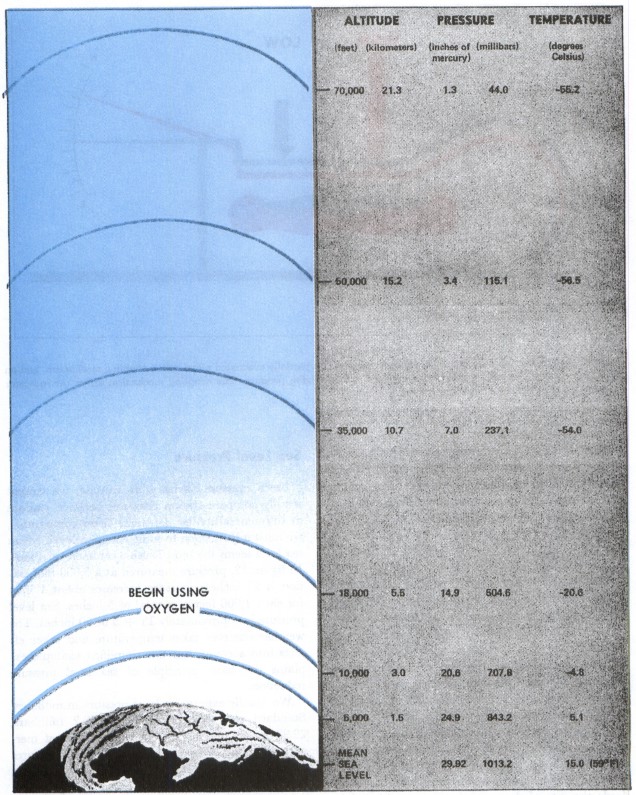
As we move upward through the atmosphere, weight of the air above becomes less and less. If we carry a barometer with us, we can measure a decrease in pressure as weight of the air above decreases. Within the lower few thousand feet of the troposphere, pressure decreases roughly one inch for each 1,000 feet increase in altitude. The higher we go, the slower is the rate of decrease with height. Figure 10 shows the pressure decrease with height in the standard atmosphere. These standard altitudes are based on standard temperatures. In the real atmosphere, temperatures are seldom standard, so let's explore temperature effects.
Temperature
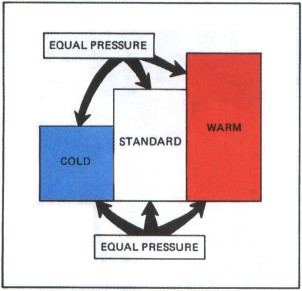
Like most substances, air expands as it becomes warmer and shrinks as it cools. Figure 11 shows three columns of air—one colder than standard, one at standard temperature, and one warmer than standard. Pressure is equal at the bottom of each column and equal at the top of each column. Therefore, pressure decrease upward through each column is the same. Vertical expansion of the warm column has made it higher than the column at standard temperature. Shrinkage of the cold column has made it shorter. Since pressure decrease is the same in each column, the rate of decrease of pressure with height in warm air is less than standard; the rate of decrease of pressure with height in cold air is greater than standard. You will soon see the importance of temperature in altimetry and weather analysis and on aircraft performance.
Sea Level Pressure
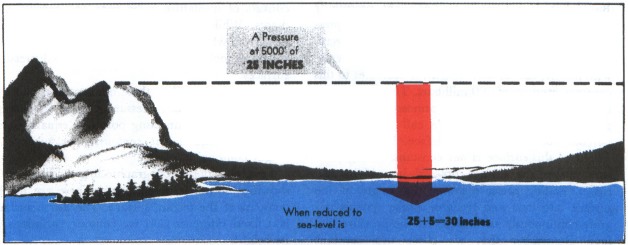
Since pressure varies with altitude, we cannot readily compare station pressures between stations at different altitudes. To make them comparable, we must adjust them to some common level. Mean sea level seems the most feasible common reference. In figure 12, pressure measured at a 5,000-foot station is 25 inches; pressure increases about 1 inch for each 1,000 feet or a total of 5 inches. Sea level pressure is approximately 25 + 5 or 30 inches. The weather observer takes temperature and other effects into account, but this simplified example explains the basic principle of sea level pressure reduction.
We usually express sea level pressure in millibars. Standard sea level pressure is 1013.2 millibars, 29.92 inches of mercury, 760 millimeters of mercury, or about 14.7 pounds per square inch. Figures 23 and 24 in chapter 4 show world-wide averages of sea level pressure for the months of July and January. Pressure changes continually, however, and departs widely from these averages. We use a sequence of weather maps to follow these changing pressures.
Pressure Analyses
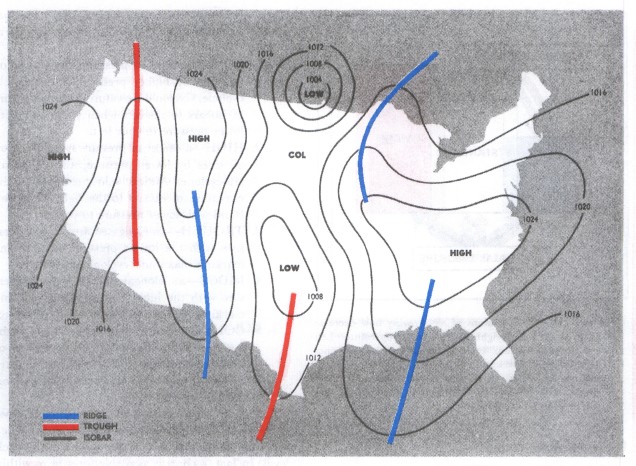
We plot sea level pressures on a map and draw lines connecting points of equal pressure. These lines of equal pressure are isobars. Hence, the surface map is an isobaric analysis showing identifiable, organized pressure patterns. Five pressure systems are shown in figure 13 and are defined as follow:
LOW—a center of pressure surrounded on all sides by higher pressure; also called a cyclone. Cyclonic curvature is the curvature of isobars to the left when you stand with lower pressure to your left.
HIGH—a center of pressure surrounded on all sides by lower pressure, also called an anticyclone. Anticyclonic curvature is the curvature of isobars to the right when you stand with lower pressure to your left.
TROUGH—an elongated area of low pressure with the lowest pressure along a line marking maximum cyclonic curvature.
RIDGE—an elongated area of high pressure with the highest pressure along a line marking maximum anticyclonic curvature.
COL—the neutral area between two highs and two lows. It also is the intersection of a trough and a ridge. The col on a pressure surface is analogous to a mountain pass on a topographic surface.
Upper air weather maps reveal these same types of pressure patterns aloft for several levels. They also show temperature, moisture, and wind at each level. In fact, a chart is available for a level within a few thousand feet of your planned cruising altitude. AVIATION WEATHER SERVICES lists the approximate heights of upper air maps and shows details of the surface map and each upper air chart. Chapter 4 of this book ties together the surface chart and upper air charts into a three-dimensional picture.
An upper air map is a constant pressure analysis. But, what do we mean by “constant pressure”? Constant pressure simply refers to a specific pressure. Let's arbitrarily choose 700 millibars. Everywhere above the earth's surface, pressure decreases with height; and at some height, it decreases to this constant pressure of 700 millibars. Therefore, there is a “surface” throughout the atmosphere at which pressure is 700 millibars. We call this the 700-millibar constant pressure surface. However, the height of this surface is not constant. Rising pressure pushes the surface upward into highs and ridges. Falling pressure lowers the height of the surface into lows and troughs. These systems migrate continuously as “waves” on the pressure surface. Remember that we chose this constant pressure surface arbitrarily as a reference. It in no way defines any discrete boundary.
The National Weather Service and military weather services take routine scheduled upper air observations—sometimes called soundings. A balloon carries aloft a radiosonde instrument which consists of miniature radio gear and sensing elements. While in flight, the radiosonde transmits data from which a specialist determines wind, temperature, moisture, and height at selected pressure surfaces.
We routinely collect these observations, plot the heights of a constant pressure surface on a map, and draw lines connecting points of equal height. These lines are height contours. But, what is a height contour?
First, consider a topographic map with contours showing variations in elevation. These are height contours of the terrain surface. The Earth surface is a fixed reference and we contour variations in its height.
The same concept applies to height contours on a constant pressure chart, except our reference is a constant pressure surface. We simply contour the heights of the pressure surface. For example, a 700-millibar constant pressure analysis is a contour map of the heights of the 700-millibar pressure surface. While the contour map is based on variations in height, these variations are small when compared to flight levels, and for all practical purposes, you may regard the 700-millibar chart as a weather map at approximately 10,000 feet or 3,048 meters.
A contour analysis shows highs, ridges, lows, and troughs aloft just as the isobaric analysis shows such systems at the surface. What we say concerning pressure patterns and systems applies equally to an isobaric or a contour analysis.
Low pressure systems quite often are regions of poor flying weather, and high pressure areas predominantly are regions of favorable flying weather. A word of caution, however—use care in applying the low pressure-bad weather, high pressure-good weather rule of thumb; it all too frequently fails. When planning a flight, gather all information possible on expected weather. Pressure patterns also bear a direct relationship to wind which is the subject of the next chapter. But first, let's look at pressure and altimeters.
Table of Contents
Previous Section: Atmospheric Pressure and Altimetry
Next Section: Altimetry
A PDF version of this book is available here. You may be able to buy a printed copy of the book from amazon.com.