Aviation Weather
full text of the classic FAA guide
THE GENERAL CIRCULATION
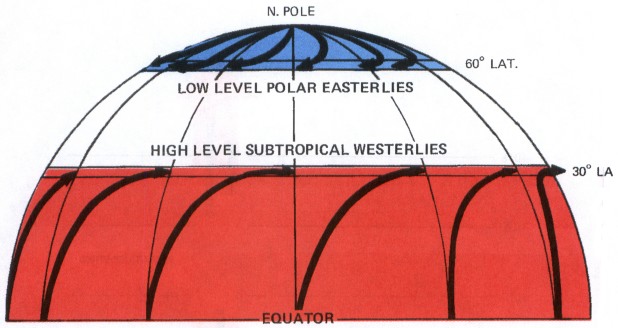
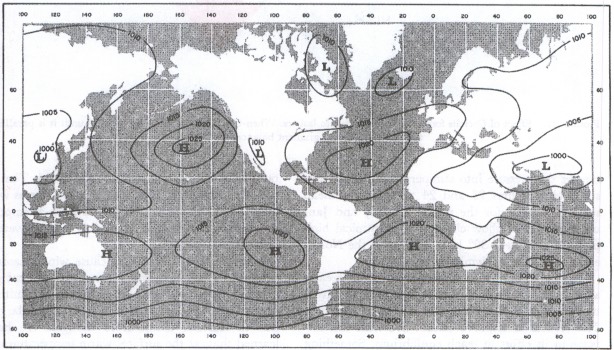
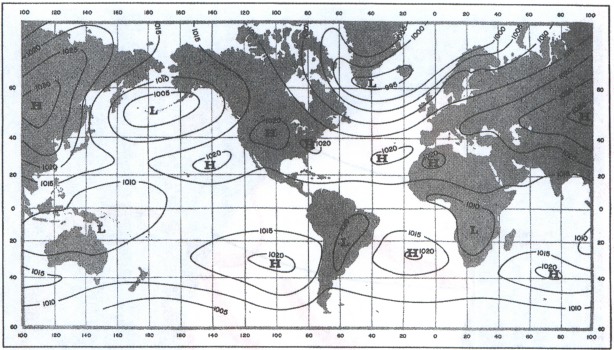
As air is forced aloft at the Equator and begins its high-level trek northward, the Coriolis force turns it to the right or to the east as shown in figure 22. Wind becomes westerly at about 30° latitude temporarily blocking further northward movement. Similarly, as air over the poles begins its low-level journey southward toward the Equator, it likewise is deflected to the right and becomes an east wind, halting for a while its southerly progress—also shown in figure 22. As a result, air literally “piles up” at about 30° and 60° latitude in both hemispheres. The added weight of the air increases the pressure into semipermanent high pressure belts. Figures 23 and 24 are maps of mean surface pressure for the months of July and January. The maps show clearly the subtropical high pressure belts near 30° latitude in both the Northern and Southern Hemispheres.
The building of these high pressure belts creates a temporary impasse disrupting the simple convective transfer between the Equator and the poles. The restless atmosphere cannot live with this impasse in its effort to reach equilibrium. Something has to give. Huge masses of air begin overturning in middle latitudes to complete the exchange.
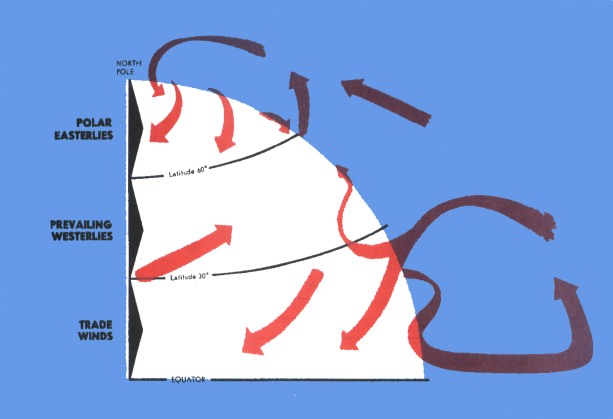
Large masses of cold air break through the northern barrier plunging southward toward the Tropics. Large midlatitude storms develop between cold outbreaks and carry warm air northward. The result is a midlatitude band of migratory storms with ever changing weather. Figure 25 is an attempt to standardize this chaotic circulation into an average general circulation.
Since pressure differences cause wind, seasonal pressure variations determine to a great extent the areas of these cold air outbreaks and midlatitude storms. But, seasonal pressure variations are largely due to seasonal temperature changes. We have learned that, at the surface, warm temperatures to a great extent determine low pressure and cold temperatures, high pressure. We have also learned that seasonal temperature changes over continents are much greater than over oceans.
During summer, warm continents tend to be areas of low pressure and the relatively cool oceans, high pressure. In winter, the reverse is true—high pressure over the cold continents and low pressure over the relatively warm oceans. Figures 23 and 24 show this seasonal pressure reversal. The same pressure variations occur in the warm and cold seasons of the Southern Hemisphere, although the effect is not as pronounced because of the much larger water areas of the Southern Hemisphere.
Cold outbreaks are strongest in the cold season and are predominantly from cold continental areas. Summer outbreaks are weaker and more likely to originate from cool water surfaces. Since these outbreaks are masses of cool, dense air, they characteristically are high pressure areas.
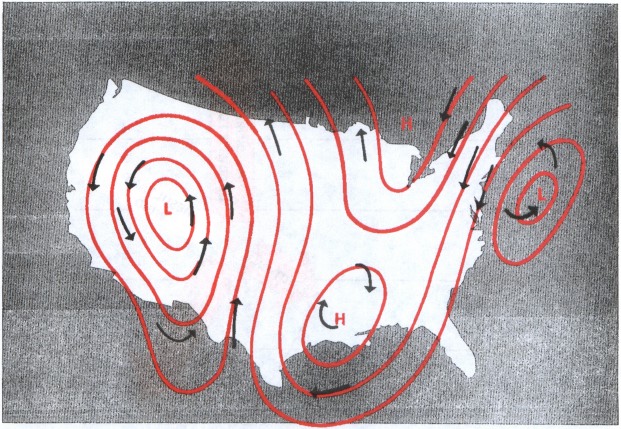
As the air tries to blow outward from the high pressure, it is deflected to the right by the Coriolis force. Thus, the wind around a high blows clockwise. The high pressure with its associated wind system is an anticyclone.
The storms that develop between high pressure systems are characterized by low pressure. As winds try to blow inward toward the center of low pressure, they also are deflected to the right. Thus, the wind around a low is counterclockwise. The low pressure and its wind system is a cyclone. Figure 26 shows winds blowing parallel to isobars (contours on upper level charts). The winds are clockwise around highs and counterclockwise around lows.
The high pressure belt at about 30° north latitude forces air outward at the surface to the north and to the south. The northbound air becomes entrained into the midlatitude storms. The southward moving air is again deflected by the Coriolis force becoming the well-known subtropical northeast trade winds. In midlatitudes, high level winds are predominantly from the west and are known as the prevailing westerlies. Polar easterlies dominate lowlevel circulation north of about 60° latitude.
These three major wind belts are shown in figure 25. Northeasterly trade winds carry tropical storms from east to west. The prevailing westerlies drive midlatitude storms generally from west to east. Few major storm systems develop in the comparatively small Arctic region; the chief influence of the polar easterlies is their contribution to the development of midlatitude storms.
Our discussion so far has said nothing about friction. Wind flow patterns aloft follow isobars or contours where friction has little effect. We cannot, however, neglect friction near the surface.
Table of Contents
Previous Section: Corious Force
Next Section: Friction
A PDF version of this book is available here. You may be able to buy a printed copy of the book from amazon.com.